This printed article is located at https://oel.listedcompany.com/financials.html
Financials
Unaudited Condensed Interim Financial Statements For The Six Months And Full Year Ended: 31-12-2025
Financials Archive![]() Note: Files are in Adobe (PDF) format.
Note: Files are in Adobe (PDF) format.
Please download the free Adobe Acrobat Reader to view these documents.
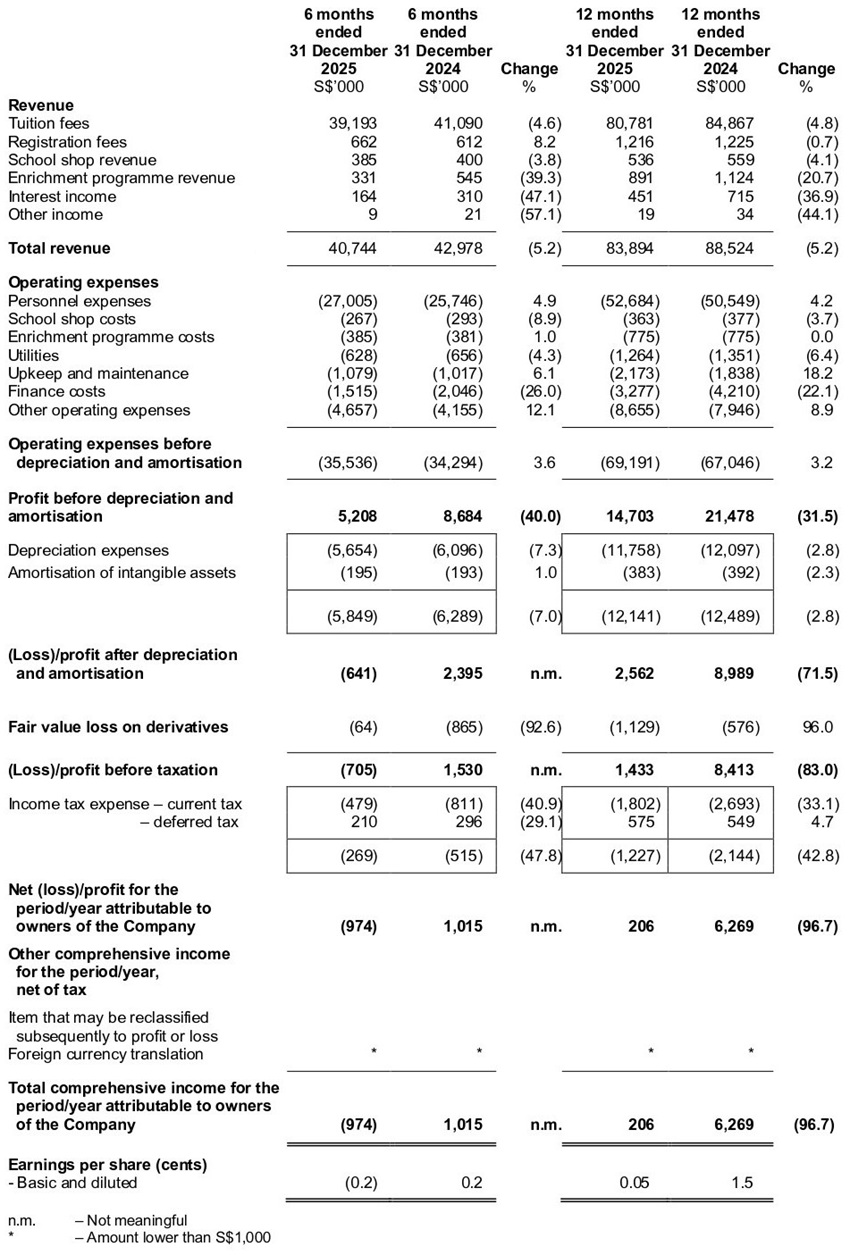
Condensed interim consolidated statement of comprehensive income For the six-month and full year ended 31 December 2025
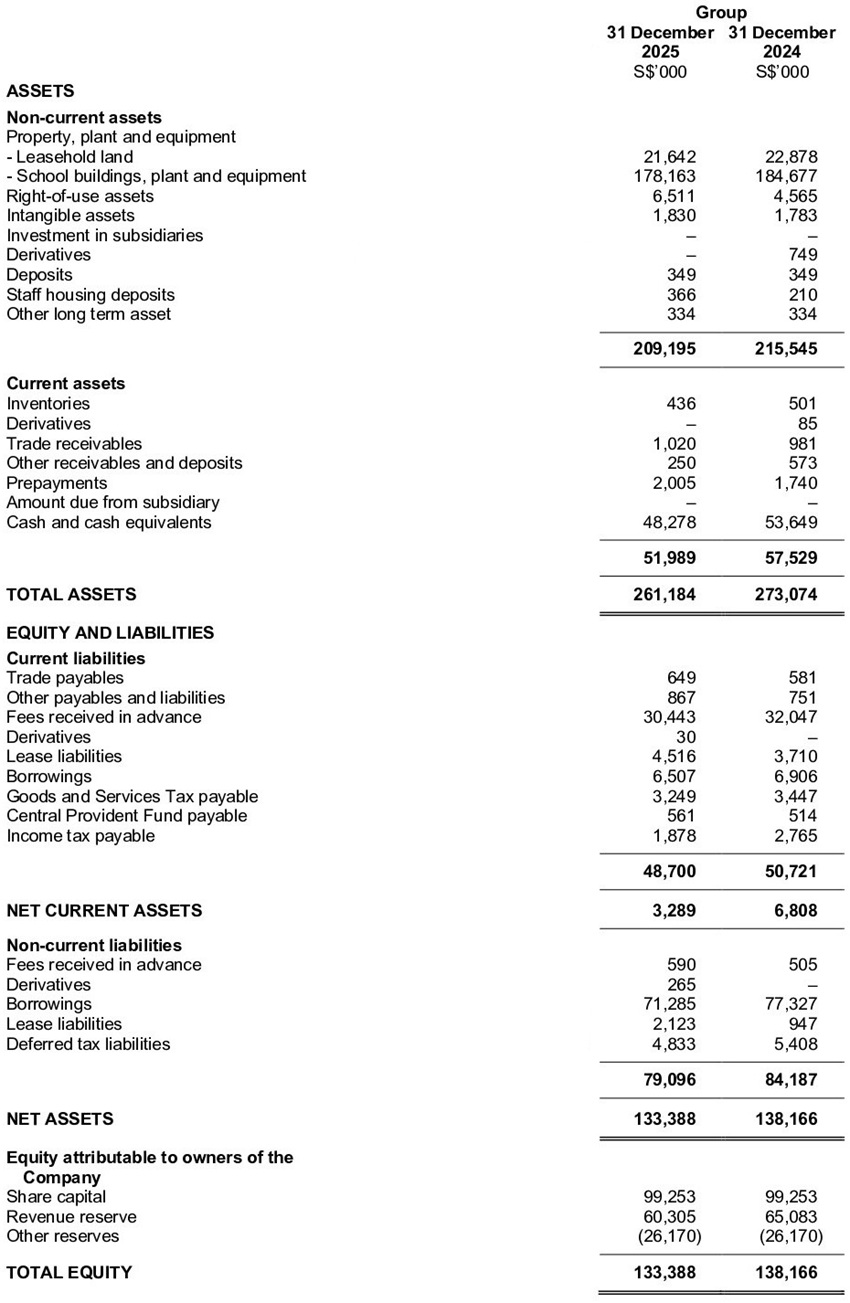
Condensed interim balance sheets As at 31 December 2025
Review of performance
Review of Income statement
The Group recorded a revenue of $40.74 million for the second half year ended 31 December 2025 (H2 2025) compared to $42.98 million for the corresponding period ended 31 December 2024 (H2 2024). For the full year ended 31 December 2025 (FY 2025), total revenue was $83.89 million compared to $88.52 million for the last financial year (FY 2024).
Details of revenue lines are as follows:
Tuition fees revenue was lower at $39.19 million in H2 2025 compared to $41.09 million in H2 2024 due to the decline in student enrolment in H2 2025. Overall, tuition fees revenue ended lower at $80.78 million for FY 2025 compared to $84.87 million for FY 2024 due to lower than expected new student enrolment for FY 2025. The current operating environment for student enrolment remained challenging due to heightened competition from other foreign system schools targeting the same pool of prospective students.
Registration fees revenue was $0.66 million in H2 2025 compared to $0.61 million in H2 2024. For FY 2025, registration fees revenue at $1.22 million was comparable to FY 2024. Registration fees were recognised over the average student life in the school (Note 14 of the Condensed Interim Consolidated Financial Statements).
School shop revenue was $0.39 million in H2 2025 compared to $0.40 million in H2 2024. School shop revenue was $0.54 million in FY 2025 compared to $0.56 million in FY 2024.
Enrichment programme revenue was $0.33 million in H2 2025 compared to $0.55 million in H2 2024. Enrichment programme revenue was lower at $0.89 million in FY 2025 compared to $1.12 million in FY 2024.
Interest income was $0.16 million in H2 2025 compared to $0.31 million in H2 2024. Interest income was lower at $0.45 million in FY 2025 compared to $0.72 million in FY 2024 due to lower prevailing interest rates in FY 2025.
Other income was at $0.01 million in H2 2025 and $0.02 million in FY 2025 compared to $0.02 million in H2 2024 and $0.03 million in FY 2024.
Total expenses before depreciation and amortisation were higher at $35.54 million in H2 2025 compared to $34.29 million in H2 2024. For FY 2025, total expenses before depreciation and amortisation were also higher at $69.19 million compared to $67.05 million in FY 2024.
Details of expenses are as follows:
Personnel expenses were $27.00 million in H2 2025 and $52.68 million in FY 2025, compared to $25.75 million in H2 2024 and $50.55 million in FY 2024. The higher personnel expenses in FY 2025 were mainly due to the requirement for additional academic staff to support new school initiatives.
School shop costs were $0.27 million in H2 2025 compared to $0.29 million in H2 2024. School shop costs were $0.36 million in FY 2025 compared to $0.38 million in FY 2024.
Enrichment programme costs at $0.39 million in H2 2025 were comparable to H2 2024. Enrichment programme costs at $0.78 million in FY 2025 were also comparable to FY 2024.
Utilities expenses were $0.63 million in H2 2025 compared to $0.66 million in H2 2024. Utilities expenses were $1.26 million in FY 2025 compared to $1.35 million in FY 2024 due to lower average tariff in FY 2025. The Group is partially using solar renewable energy as its source of electricity for the school campus.
Upkeep and maintenance expenses were $1.08 million in H2 2025 compared to 1.02 million in H2 2024. Upkeep and maintenance expenses were $2.17 million in FY 2025 compared to $1.84 million in FY 2024.
Finance costs were lower at $1.52 million in H2 2025 compared to 2.05 million in H2 2024. Finance costs were also lower at $3.28 million in FY 2025 compared to $4.21 million in FY 2024 due to reducing outstanding bank borrowings at lower prevailing interest rates in FY 2025.
Other operating expenses were $4.66 million in H2 2025 and $8.66 million in FY 2025, compared to $4.16 million in H2 2024 and $7.95 million in FY 2024. The higher other operating expenses in H2 2025 and FY 2025 were mainly due to increase in insurance, property tax expenses, and other general costs inflation.
Depreciation and amortisation expenses were $5.85 million in H2 2025 compared to $6.29 million in H2 2024. Depreciation and amortisation expenses were $12.14 million in FY 2025 compared to $12.49 million in FY 2024.
The Group recorded a $0.06 million and $1.13 million fair value loss in H2 2025 and FY 2025, compared to fair value loss of $0.86 million and $0.58 million in H2 2024 and FY2024 respectively. The fair value loss arose from fair value changes of the interest-rate-swap contracts that the Group entered to hedge against rising interest rates on bank borrowings. More information is provided in Note 10 of the Condensed Interim Consolidated Financial Statements.
The Group recorded a loss before taxation of $0.71 million in H2 2025 compared to profit of $1.53 million in H2 2024. Profit before taxation for FY 2025 was $1.43 million compared to $8.41 million in FY 2024.
Income tax expense for H2 2025 and FY 2025 were $0.27 million and $1.23 million respectively. The H2 2025 and FY 2025 income tax expense comprised mainly the provision for current tax of $0.48 million and $1.80 million respectively. The reversal of net deferred tax for H2 2025 and FY 2025 were $0.21 million and $0.58 million respectively. The income tax expense in H2 2024 and FY 2024 were $0.52 million and $2.14 million respectively.
Net loss after taxation in H2 2025 was $0.98 million compared to net profit of $1.01 million in H2 2024. Net profit after taxation for FY 2025 was $0.21 million compared to $6.27 million for FY 2024.
Review of Balance Sheet as at 31 December 2025
Total property, plant and equipment and right-of-use assets at 31 December 2025 amounted to $206.32 million compared to $212.12 million at 31 December 2024. The decrease of $5.80 million was due mainly to the depreciation charge for the financial year, offset by the additional right-of-use assets and other plant and equipment of $7.20 million and $0.65 million respectively during the financial year.
Derivatives liabilities (current and non-current) at 31 December 2025 was $0.30 million compared to derivatives assets of $0.83 million at 31 December 2024. The fair value reversal and movement arose from fair value changes of the interest-rate-swap contracts that the Group entered to hedge against rising interest rates on bank borrowings. More information is provided in Note 10 of the Condensed Interim Consolidated Financial Statements.
Inventories of school uniforms, books and stationery for sale at the school shop were $0.44 million at 31 December 2025 compared to $0.50 million at 31 December 2024.
Trade receivables comprised amounts attributable to tuition fees, registration fees, school shop revenue and other revenue. Trade receivables of $1.02 million at 31 December 2025 were higher compared to $0.98 million at 31 December 2024 due mainly to the timing of collection of the receivables for the reporting year.
Other receivables and deposits at 31 December 2025 were $0.25 million compared to $0.57 million at 31 December 2024.
Prepayments at 31 December 2025 were $2.01 million compared to $1.74 million at 31 December 2024.
The Group's cash and cash equivalents amounted to $48.28 million at 31 December 2025 and $53.65 million at 31 December 2024. The decrease was due to cash movements (cash generated or cash used) in operating, investing and financing activities as explained in the Review of Group cash flow below.
Trade and other payables and liabilities were higher at $1.52 million at 31 December 2025 compared to $1.33 million at 31 December 2024 due mainly to timing of payments of operating expenses.
Total fees received in advance (current and non-current) was $31.03 million at 31 December 2025 and $32.55 million at 31 December 2024. The total fees received in advance at 31 December 2025 and 31 December 2024 comprised tuition fees collected before the commencement of the next semester in January, and registration fees collected upon enrolment.
Lease liabilities (current and non-current) were $6.64 million at 31 December 2025 compared to $4.66 million at 31 December 2024. The variation in the lease liabilities was due to the expiration and renewal of the lease contracts for teachers' accommodation.
Borrowings - Bank Loan (current and non-current) was $77.79 million at 31 December 2025 compared to $84.23 million at 31 December 2024. The Group paid the quarterly instalment of $1.54 million each in January, April, July and October 2025. More information on the bank loan facility is disclosed in Note 15 in the Condensed Interim Consolidated Financial Statements.
Goods and Services Tax payable of $3.25 million and $3.45 million at 31 December 2025 and 31 December 2024 respectively arose mainly from the billing of next semester's tuition fees.
Deferred tax liabilities amounted to $4.83 million at 31 December 2025 compared to $5.41 million at 31 December 2024. The net deferred tax liabilities arose from the tax effect on temporary differences between the net book value and the tax-written-down-value of qualifying assets.
Review of Group cash flow for the full year ended 31 December 2025
The net cash generated from operating activities in FY 2025 was $15.49 million, which consisted of cash inflow from operating activities before working capital changes of $19.47 million, net working capital outflow of $1.74 million and interest received of $0.45 million and income tax paid of $2.69 million.
The net cash used in investing activities of $1.04 million was for the capital expenditure in the normal course of business.
The net cash used in financing activities of $19.83 million comprised lease payments of $5.31 million, lease interest paid of $0.25 million, payment of bank loan interest of $3.13 million, bank loan repayment of $6.16 million and dividends payment of $4.98 million during the reporting period.
Commentary
The Group notes that global economic environment and risks remain uncertain and volatile. Geopolitical tensions continue to be elevated, while the rapid advancement of artificial intelligence is driving significant job displacement worldwide.
Under these circumstances, the Group expects the operating landscape for foreign system schools to remain challenging and highly competitive.
The prolonged effects of global economic disruption have impacted student enrolment and revenue. Despite these headwinds, the Group remains committed to investing in its education services, teaching professionals and staff to uphold academic excellence and long term value.
In the coming year, the Group will refresh its service offerings through the expansion of competitive sports and enrichment programmes, while strengthening engagement with the Parents' Association to enhance outreach and support student enrolment.
In parallel, the Group continues to adopt a prudent and disciplined approach to cost management and operating expenditure to safeguard financial resilience.

81 Pasir Ris Heights, Singapore 519292 | Tel (65) 6738 0211 | Fax (65) 6733-8825